10th Period: School Privatizers Fundamentally Change Public Schools
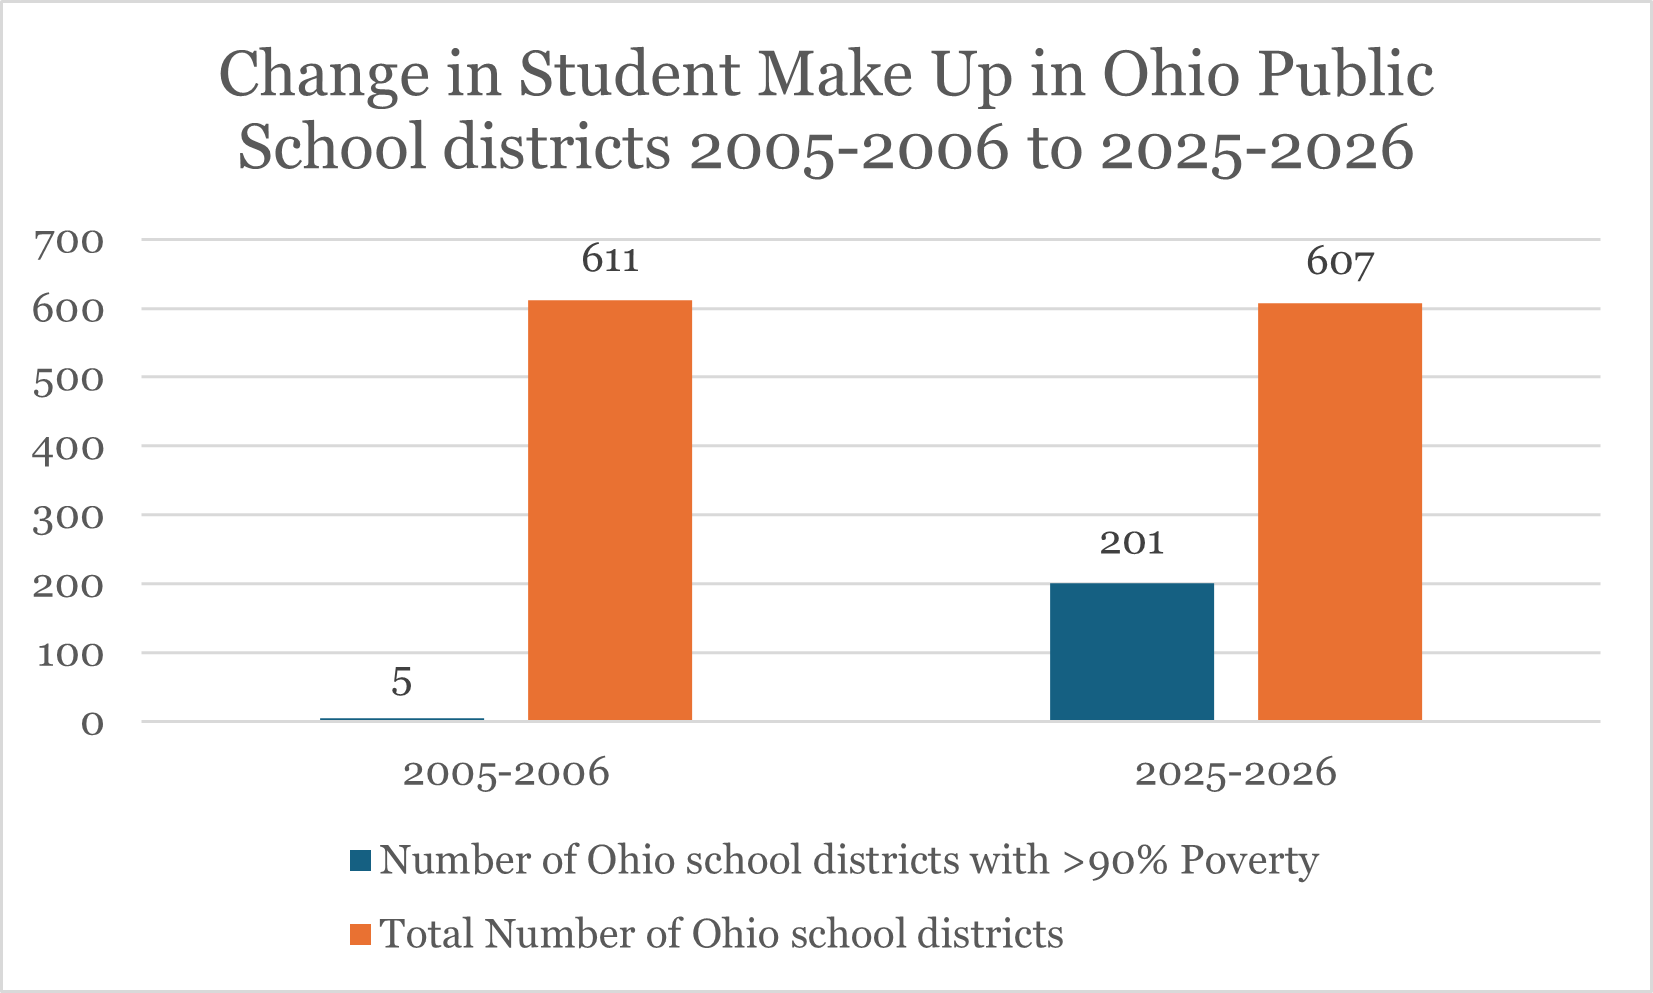
Today, 201 Ohio public school districts have students who are 90% or more economically disadvantaged. In 2005-2006, there were only 5 districts that fit that bill.
Sometimes, I’m guilty of missing the forest in spite of the trees. I get into the minutiae of graduation rates, or funding, or whatever and forget to pull back and look at the big picture.
Last week was just the latest example.
During my post railing against Ohio Charter Schools’ failure to graduate students, I came across a datapoint that I treated too flippantly: 201 Ohio school districts today have student populations 90% or more of whom qualify as economically disadvantaged. I kind of breezed past that fact in the post.
I shouldn’t have. I should have said, “What the fuck? One out of every 3 Ohio school districts now have student populations that are 90% or more economically disadvantaged? Whoa! How did that happen?”
What changed here?
I decided to go back as far as Ohio’s report cards go: the 2005-2006 school year (the year I first ran for State Rep, which sure makes me feel old!).
Twenty years ago.
Wanna take a stab at how many school districts had 90% or more of their students qualify as economically disadvantaged then?
Five.
That’s right.
5.
Here they are: Cleveland, East Cleveland, Jefferson Township, Lockland and Mt. Healthy.
That’s it.
The next highest was Akron at 77%.
Today, there are 81 with 100% economically disadvantaged students. Another 29 that are 99.9% economically disadvantaged. Another 22 that are 99.8%.
You get the pattern.
What the fuck is going on?
EdChoice. That’s what.
That’s when I became suspicious. See, 2005-2006 was the first year of EdChoice vouchers. Now, of course, it’s an unconstitutional, nearly $1 billion annual expenditure that affects all but a handful of school districts.
So what are the EdChoice populations in the districts that are 90% or more economically disadvantaged vs. the districts that are less than 90% economically disadvantaged?
The 201 poorest districts in the state account for 47% of all EdChoice students. The remaining 406 districts account for 53%. On a per district basis, the poorest districts have 333 EdChoice students. The remaining districts have about 180 students taking EdChoice vouchers.
So clearly EdChoice is disproportionately affecting the 201 districts that are now 90% or more economically disadvantaged.
EdChoice expansion — the universal voucher program — also appears to be having an outsized impact. In the 2021-22 school year — just before the vouchers became universal for everyone — 77 Ohio school districts had 90% or more students listed as economically disadvantaged. Still 15 times more than in the year EdChoice started, but still.
Now, it’s more than one-and-a-half times as many districts that fit that bill. (By the way, these data once again demonstrate that it’s wealthier students taking the vouchers. But I digress.)
Why it Matters
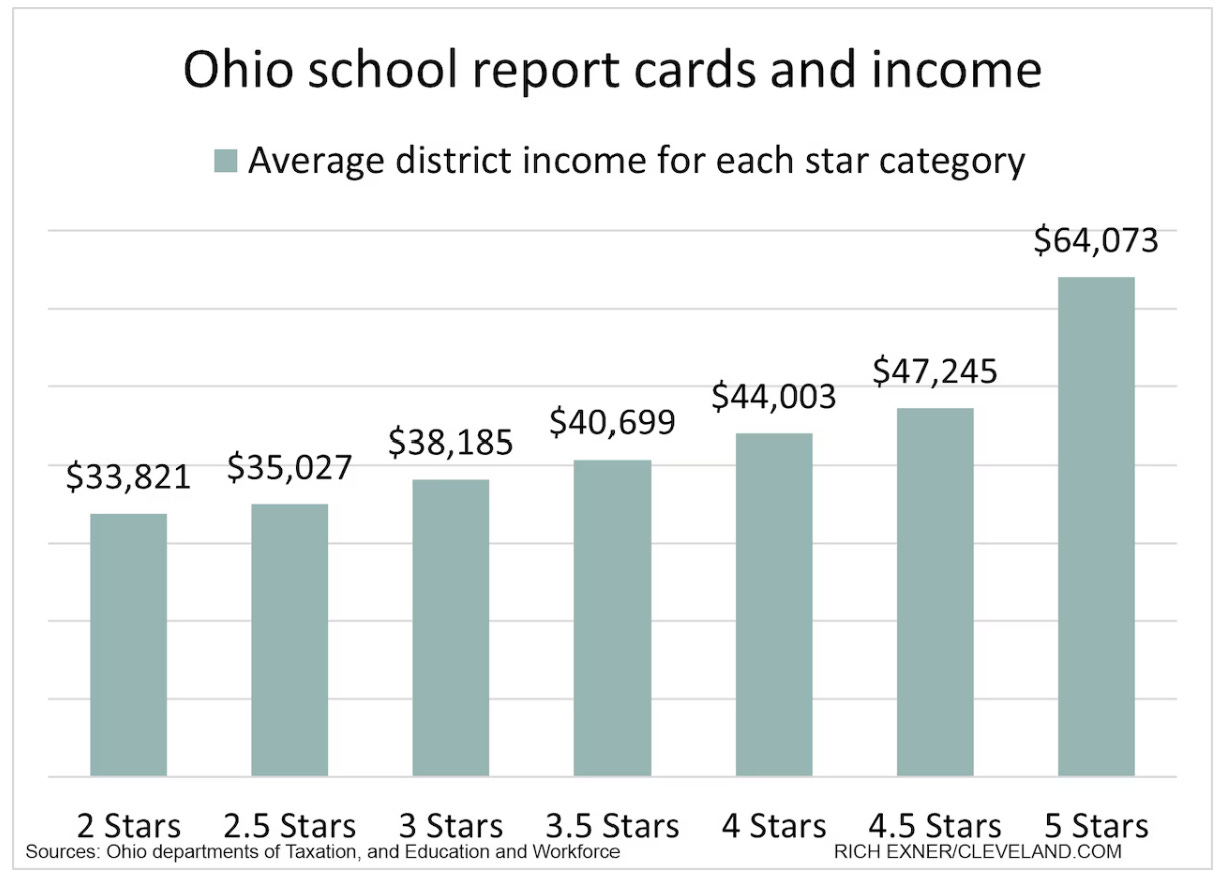
The issue with poorer student populations is that school district test scores are going to suffer. Because test scores measure poverty better than student achievement. And always have.
So, while the median Ohio public school district saw a nearly doubling of their percentage of students designated as economically disadvantaged over the last 20 years from about 25% to about 50%, their Performance Index (PI) score (a summation of how all their students did on state proficiency tests) dropped by only about 10 percent.
Yet not all is lost. There were many districts that saw large percentage increases of economically disadvantaged students, yet saw improvement on their PI scores.
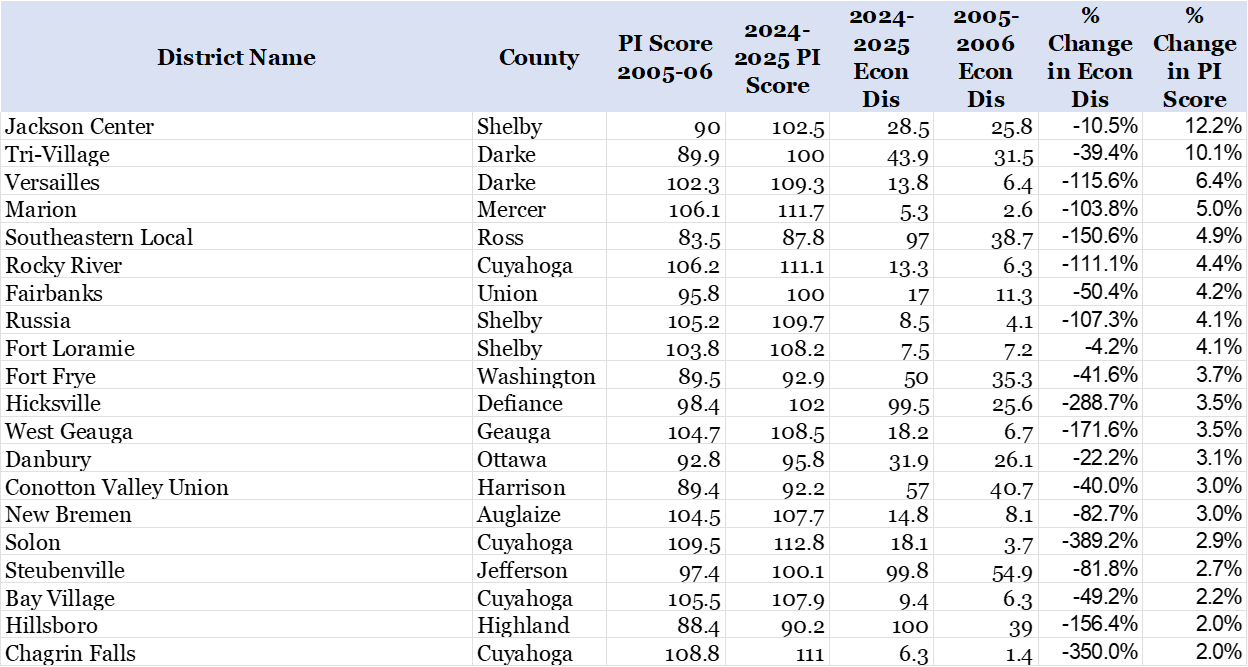
For example, Southeastern Local in Ross County jumped from an economically disadvantaged rate of 38.7% in 2005-2006 to 97% today — an increase of more than 150%. Yet their PI score increased by 5% from 83.5 to 87.8. Likewise, Hicksville in Defiance County jumped from 25.5% to 99.5% economically disadvantaged students yet saw their PI score improve from 98.4 to 102 (the highest possible PI score is 109).
However, the overwhelming majority of districts (545 of 601 or 91%) saw PI score drops following their economically disadvantage population jumps. And, again, this is on top of the 20 years of testing regime changes meant to make the tests more and more difficult, COVID-related issues and other challenges these districts and students now face.
Considering all that’s changed, COVID and the rapid increase in economically disadvantaged student populations, the fact that the typical Ohio public school district has only seen a 10% drop in their PI scores is a remarkable achievement, actually.
50,000 foot view
So, just thinking out loud here: if one were to try to convince the public that their school systems are failing, how would that plan look different than the one that happened in Ohio?
You know, using poverty-sensitive test scores to measure “success” while creating programs that make public school district populations poorer.
Hm.
Maybe someone should introduce legislation to kill this unconstitutional program and use that $1 billion or so in currently unaudited money being sent directly to private, religious schools and use it instead to fully fund the educations of the 1.6 million kids in Ohio’s public school districts?
The time has come. End EdChoice. Now.
This blog post has been shared by permission from the author.
Readers wishing to comment on the content are encouraged to do so via the link to the original post.
Find the original post here:
The views expressed by the blogger are not necessarily those of NEPC.